Bullish continuation
- Price above VWAP and a rising EMA
- Higher high and higher low structure
- Pullback holds support with lighter volume
- Momentum and volume strengthen on the next push
Follow 1-minute candles, use the chart drawing toolbar for horizontal levels, and journal each intraday high or low beside the chart.
Use the left toolbar to draw horizontal lines.
Trend and intraday fair-value overlays.
Momentum pane for strength and exhaustion.
Momentum and trend-change confirmation.
Live TradingView screener sorted by top gainers.
Use these clues as confirmation around a marked level. Stronger setups normally have trend, structure, momentum, and volume pointing in the same direction.
| Indicator | Bullish clue | Bearish clue | Watch out |
|---|---|---|---|
| VWAP | Price holds above VWAP; pullbacks reclaim it. | Price stays below VWAP; rallies reject it. | Repeated crosses usually mean chop. |
| EMA | EMA slopes up and price respects it as support. | EMA slopes down and price rejects it as resistance. | A flat EMA has little directional value. |
| RSI | RSI holds above 50 and pushes toward 60–70. | RSI stays below 50 and falls toward 30–40. | Overbought or oversold alone is not an entry. |
| MACD | Bullish cross with a rising histogram. | Bearish cross with a falling histogram. | Crosses lag and can whipsaw in ranges. |
| Volume | Expansion on a breakout or strong reclaim. | Expansion on a breakdown or failed bounce. | Low-volume moves are easier to reverse. |
| Levels | Break, close above, then hold the retest. | Break, close below, then fail the retest. | A wick through a level is not a confirmed break. |
Identify pre-market high/low, prior-day levels, VWAP, and clean support or resistance.
Let price reach the level and show a break, rejection, reclaim, or retest.
Check candle close, volume, trend, RSI/MACD agreement, and a clear invalidation point.
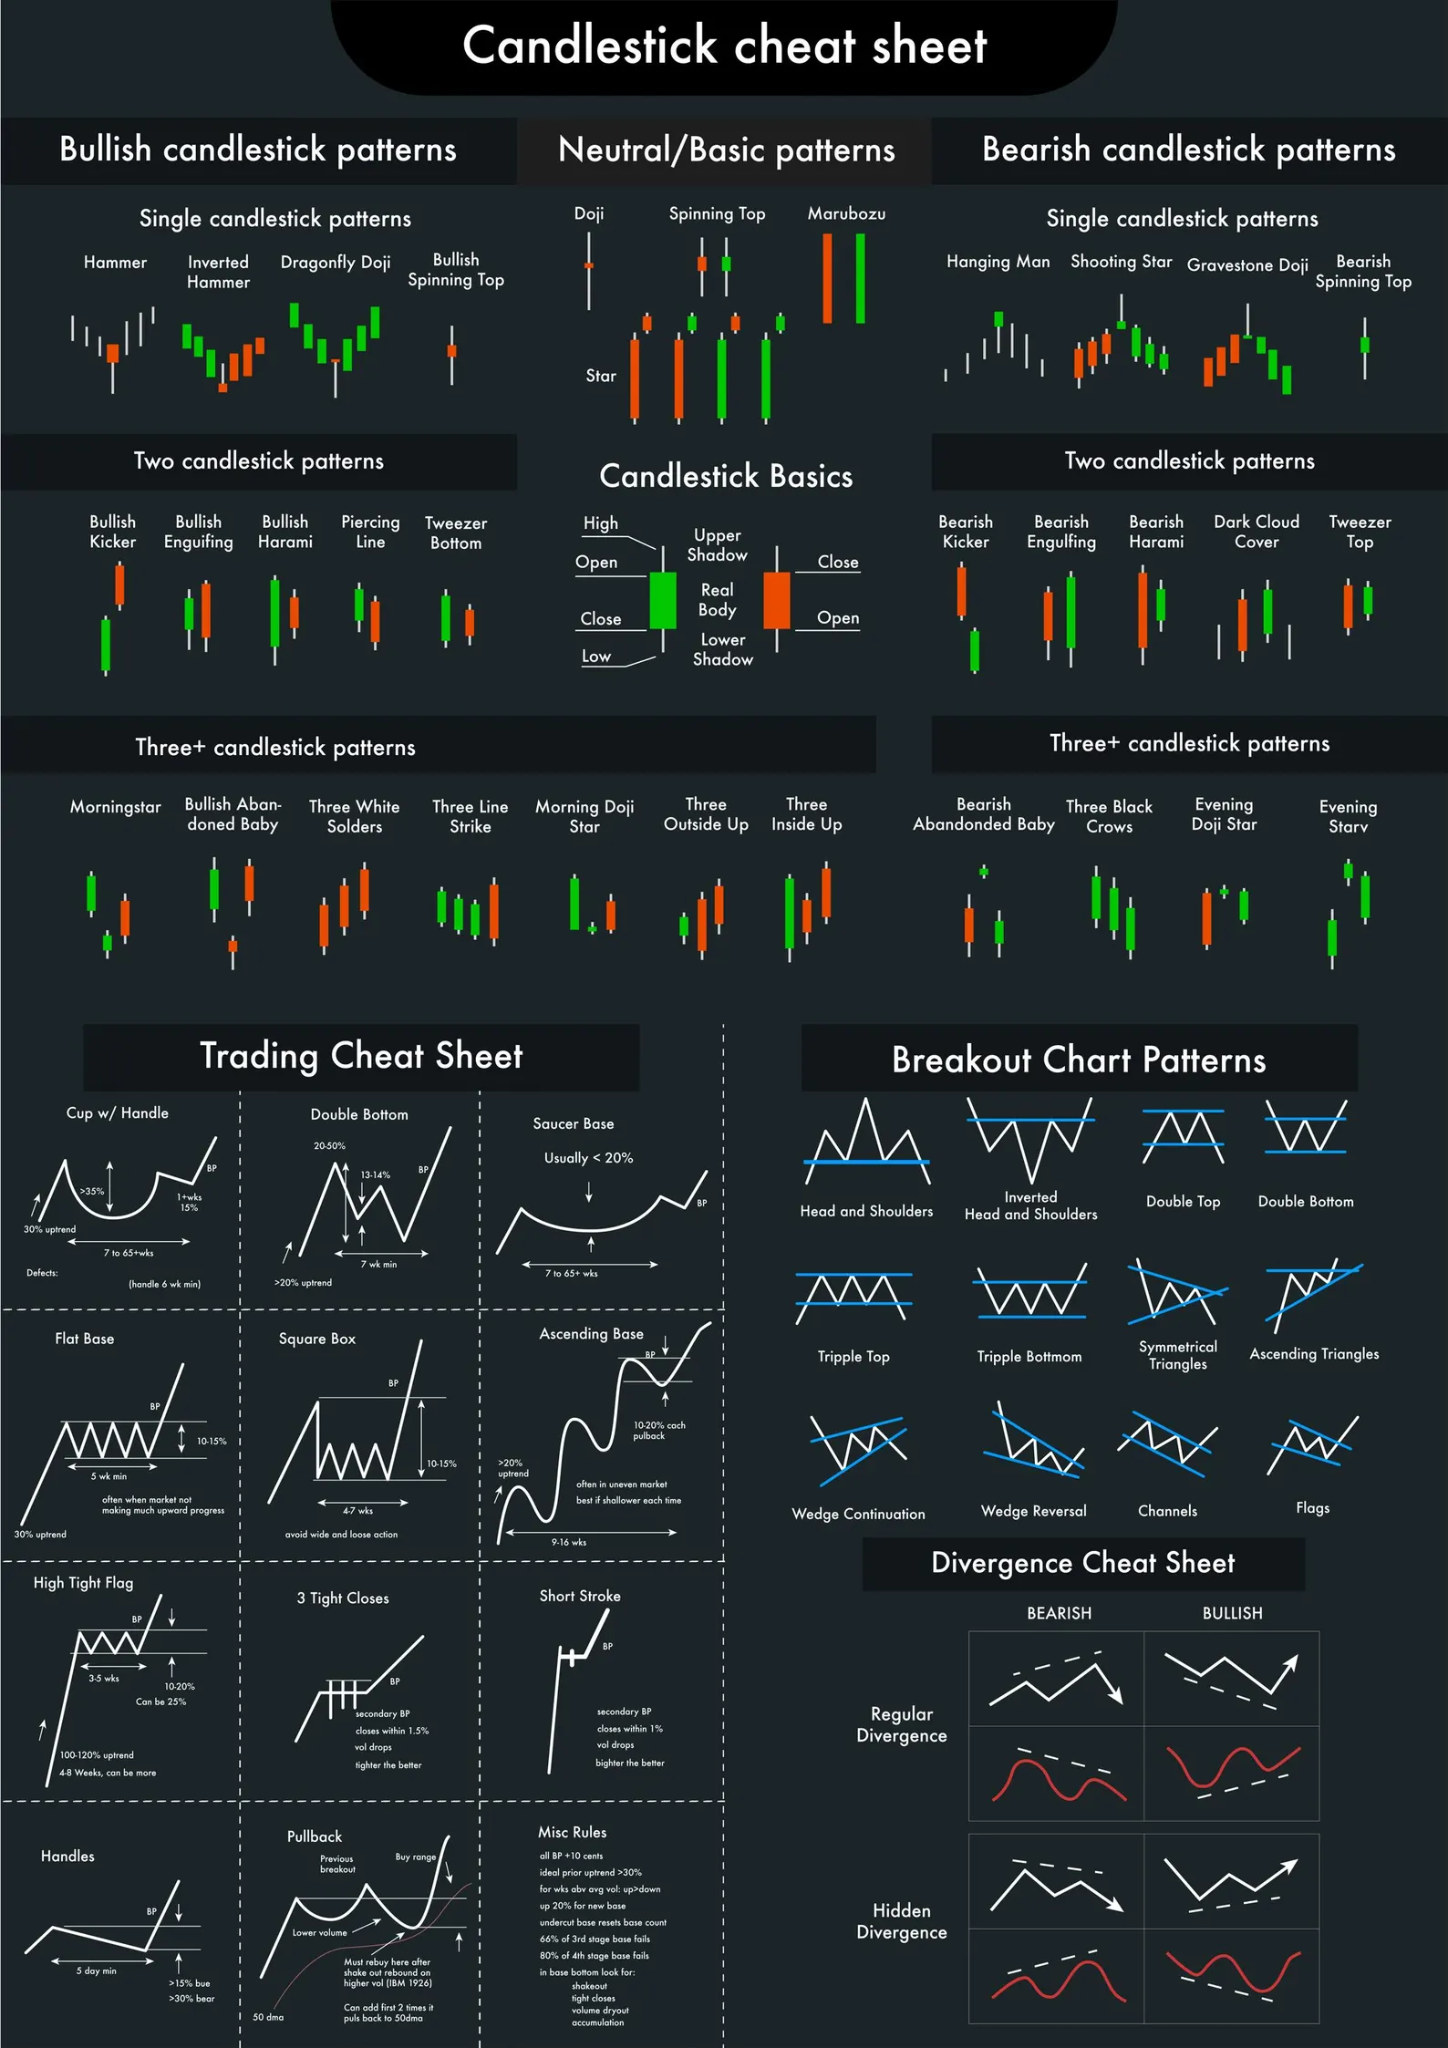
Review common bullish, bearish, breakout, and divergence patterns while planning a setup.